Applied Statistics Using R
If you’re in North America, please visit our Sage College Publishing website to purchase or sample this book:
Go to College Publishing WebsiteDescription
If you want to learn to use R for data analysis but aren’t sure how to get started, this practical book will help you find the right path through your data.
Drawing on real-world data to show you how to use different techniques in practice, it helps you progress your programming and statistics knowledge so you can apply the most appropriate tools in your research.
It starts with descriptive statistics and moves through regression to advanced techniques such as structural equation modelling and Bayesian statistics, all with digestible mathematical detail for beginner researchers.
The book:
- Shows you how to use R packages and apply functions, adjusting them to suit different datasets.
- Gives you the tools to try new statistical techniques and empowers you to become confident using them.
- Encourages you to learn by doing when running and adapting the authors’ own code.
- Equips you with solutions to overcome the potential challenges of working with real data that may be messy or imperfect.
Contents
Chapter 1: Introduction to R
Chapter 1: Introduction to R
Chapter 2: Importing and working with data in R
Chapter 2: Importing and working with data in R
Chapter 3: How does R work?
Chapter 3: How does R work?
Chapter 4: Data management
Chapter 4: Data management
Chapter 5: Data visualisation with ggplot2
Chapter 5: Data visualisation with ggplot2
Chapter 6: Descriptive statistics
Chapter 6: Descriptive statistics
Chapter 7: Simple (bivariate) regression
Chapter 7: Simple (bivariate) regression
Chapter 8: Multiple linear regression
Chapter 8: Multiple linear regression
Chapter 9: Dummy-variable regression
Chapter 9: Dummy-variable regression
Chapter 10: Moderation/interaction analysis using regression
Chapter 10: Moderation/interaction analysis using regression
Chapter 11: Logistic regression
Chapter 11: Logistic regression
Chapter 12: Multilevel and longitudinal analysis
Chapter 12: Multilevel and longitudinal analysis
Chapter 13: Factor analysis
Chapter 13: Factor analysis
Chapter 14: Structural equation modelling
Chapter 14: Structural equation modelling
Chapter 15: Bayesian statistics
Chapter 15: Bayesian statistics
Description
If you want to learn to use R for data analysis but aren’t sure how to get started, this practical book will help you find the right path through your data.
Drawing on real-world data to show you how to use different techniques in practice, it helps you progress your programming and statistics knowledge so you can apply the most appropriate tools in your research.
It starts with descriptive statistics and moves through regression to advanced techniques such as structural equation modelling and Bayesian statistics, all with digestible mathematical detail for beginner researchers.
The book:
- Shows you how to use R packages and apply functions, adjusting them to suit different datasets.
- Gives you the tools to try new statistical techniques and empowers you to become confident using them.
- Encourages you to learn by doing when running and adapting the authors’ own code.
- Equips you with solutions to overcome the potential challenges of working with real data that may be messy or imperfect.
Contents
Chapter 1: Introduction to R
Chapter 1: Introduction to R
Chapter 2: Importing and working with data in R
Chapter 2: Importing and working with data in R
Chapter 3: How does R work?
Chapter 3: How does R work?
Chapter 4: Data management
Chapter 4: Data management
Chapter 5: Data visualisation with ggplot2
Chapter 5: Data visualisation with ggplot2
Chapter 6: Descriptive statistics
Chapter 6: Descriptive statistics
Chapter 7: Simple (bivariate) regression
Chapter 7: Simple (bivariate) regression
Chapter 8: Multiple linear regression
Chapter 8: Multiple linear regression
Chapter 9: Dummy-variable regression
Chapter 9: Dummy-variable regression
Chapter 10: Moderation/interaction analysis using regression
Chapter 10: Moderation/interaction analysis using regression
Chapter 11: Logistic regression
Chapter 11: Logistic regression
Chapter 12: Multilevel and longitudinal analysis
Chapter 12: Multilevel and longitudinal analysis
Chapter 13: Factor analysis
Chapter 13: Factor analysis
Chapter 14: Structural equation modelling
Chapter 14: Structural equation modelling
Chapter 15: Bayesian statistics
Chapter 15: Bayesian statistics
Reviews
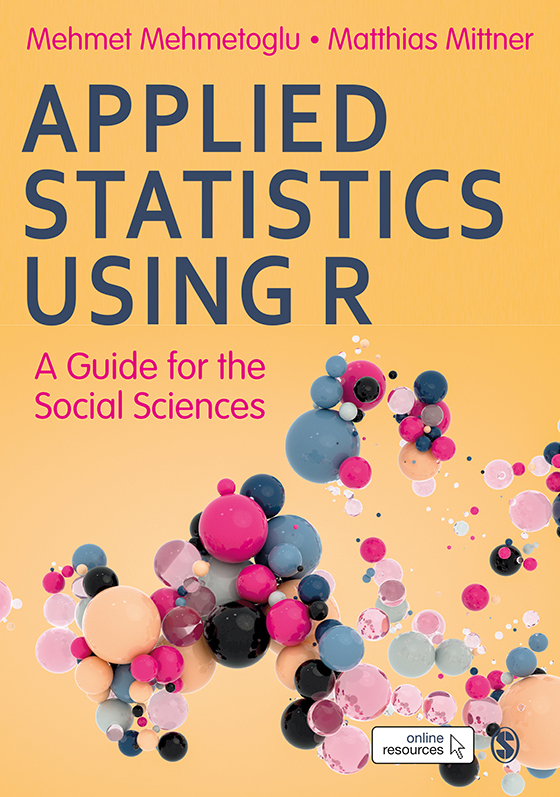

Applied Statistics Using R
A Guide for the Social Sciences
November 2021 | 472 pages | Sage UK
| Format | Published Date | ISBN | Price |
|---|
If you want to learn to use R for data analysis but aren’t sure how to get started, this practical book will help you find the right path through your data.
Drawing on real-world data to show you how to use different techniques in practice, it helps you progress your programming and statistics knowledge so you can apply the most appropriate tools in your research.
It starts with descriptive statistics and moves through regression to advanced techniques such as structural equation modelling and Bayesian statistics, all with digestible mathematical detail for beginner researchers.
The book:
- Shows you how to use R packages and apply functions, adjusting them to suit different datasets.
- Gives you the tools to try new statistical techniques and empowers you to become confident using them.
- Encourages you to learn by doing when running and adapting the authors’ own code.
- Equips you with solutions to overcome the potential challenges of working with real data that may be messy or imperfect.
Table Of Contents:
- Chapter 1: Introduction to R
- Chapter 2: Importing and working with data in R
- Chapter 3: How does R work?
- Chapter 4: Data management
- Chapter 5: Data visualisation with ggplot2
- Chapter 6: Descriptive statistics
- Chapter 7: Simple (bivariate) regression
- Chapter 8: Multiple linear regression
- Chapter 9: Dummy-variable regression
- Chapter 10: Moderation/interaction analysis using regression
- Chapter 11: Logistic regression
- Chapter 12: Multilevel and longitudinal analysis
- Chapter 13: Factor analysis
- Chapter 14: Structural equation modelling
- Chapter 15: Bayesian statistics